With the launch of Prometheus 3.0, you can now access new features that improve interoperability with OpenTelemetry.
In our previous blog post, we detailed how to stream ThousandEyes data into older versions of Prometheus using ThousandEyes OpenTelemetry data model version 1. However, with the new release of Prometheus 3.0, you can now use the data model version 2 from ThousandEyes OpenTelemetry, as the new Prometheus version supports resource attributes.
This blog post outlines the steps to stream data from ThousandEyes directly to Prometheus using OpenTelemetry.
Prerequisites:
- Prometheus version 3.0 or higher
- SSL certificate signed by a trusted certificate authority (CA) for Prometheus
- A ThousandEyes account
Step 1: Configure Prometheus
- SSL Certificate: Ensure your Prometheus instance has a valid SSL certificate signed by a trusted Certificate Authority (CA).
- Enable OTLP Receiver: Activate the OTLP receiver by setting the CLI flag
--web.enable-otlp-receiver - Prometheus Out-of-order Configuration: Using Code 1 below, configure Prometheus to handle out-of-order ingestion, which can occur when multiple replicas of the collector send data simultaneously.
storage:
  tsdb:
    out_of_order_time_window: 3h
Code 1. Prometheus out-of-order configuration
- Promote Resource Attributes: By default, Prometheus does not promote any resource attributes. You can promote all the ThousandEyes resource attributes using the configuration in Code 2.
otlp:
  promote_resource_attributes:
    - "server.address"
    - "server.port"
    - "url.scheme"
    - "http.request.method"
    - "http.route"
    - "network.transport"
    - "thousandeyes.target.agent.id"
    - "thousandeyes.target.agent.name"
    - "thousandeyes.target.agent.location"
    - "network.io.direction"
    - "network.prefix"
    - "thousandeyes.monitor.id"
    - "thousandeyes.monitor.name"
    - "thousandeyes.monitor.location"
    - "dns.question.name"
    - "ftp.request.command"
    - "thousandeyes.stream.id"
    - "thousandeyes.test.domain"
    - "thousandeyes.test.id"
    - "thousandeyes.test.name"
    - "thousandeyes.test.type"
    - "thousandeyes.source.agent.id"
    - "thousandeyes.source.agent.location"
    - "thousandeyes.source.agent.name"
    - "thousandeyes.data.version"
    - "thousandeyes.permalink"
    - "thousandeyes.test.step"
    - "thousandeyes.account.id"
Code 2. Prometheus promote_resource_attributes configuration
Please refer to Prometheus documentation for HTTPS and authentication configuration steps.
Step 2: Create a ThousandEyes HTTP Network Test
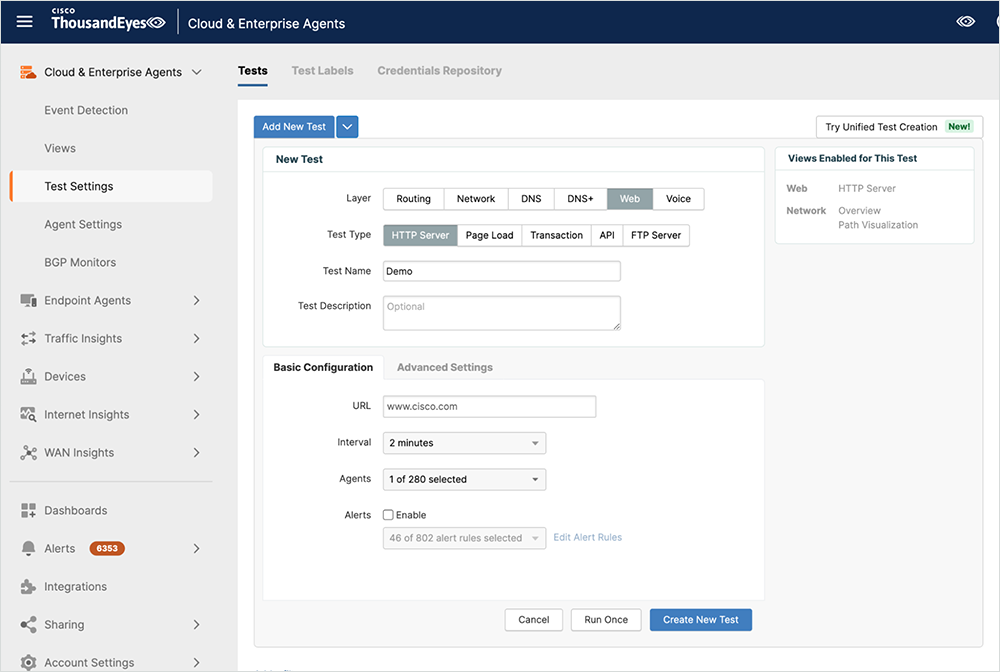
Before sending ThousandEyes metrics over OTel, it's essential to first capture some test data. Begin by navigating to the "Cloud & Enterprise Agents > Test Settings" page and creating a ThousandEyes HTTP network test, as shown in Figure 1 below.

For more information, watch this tutorial.
Step 3: Create an Integration
Now that the data is available, let’s set-up the streaming integration to Prometheus.
As you can see in the Prometheus documentation, the OTLP receiver datapoint is https://<your-domain>:<your-port>/api/v1/otlp/v1/metrics.
Navigate to the Integrations page, click on the “+ New integration” button, and select “ThousandEyes for OpenTelemetry.”

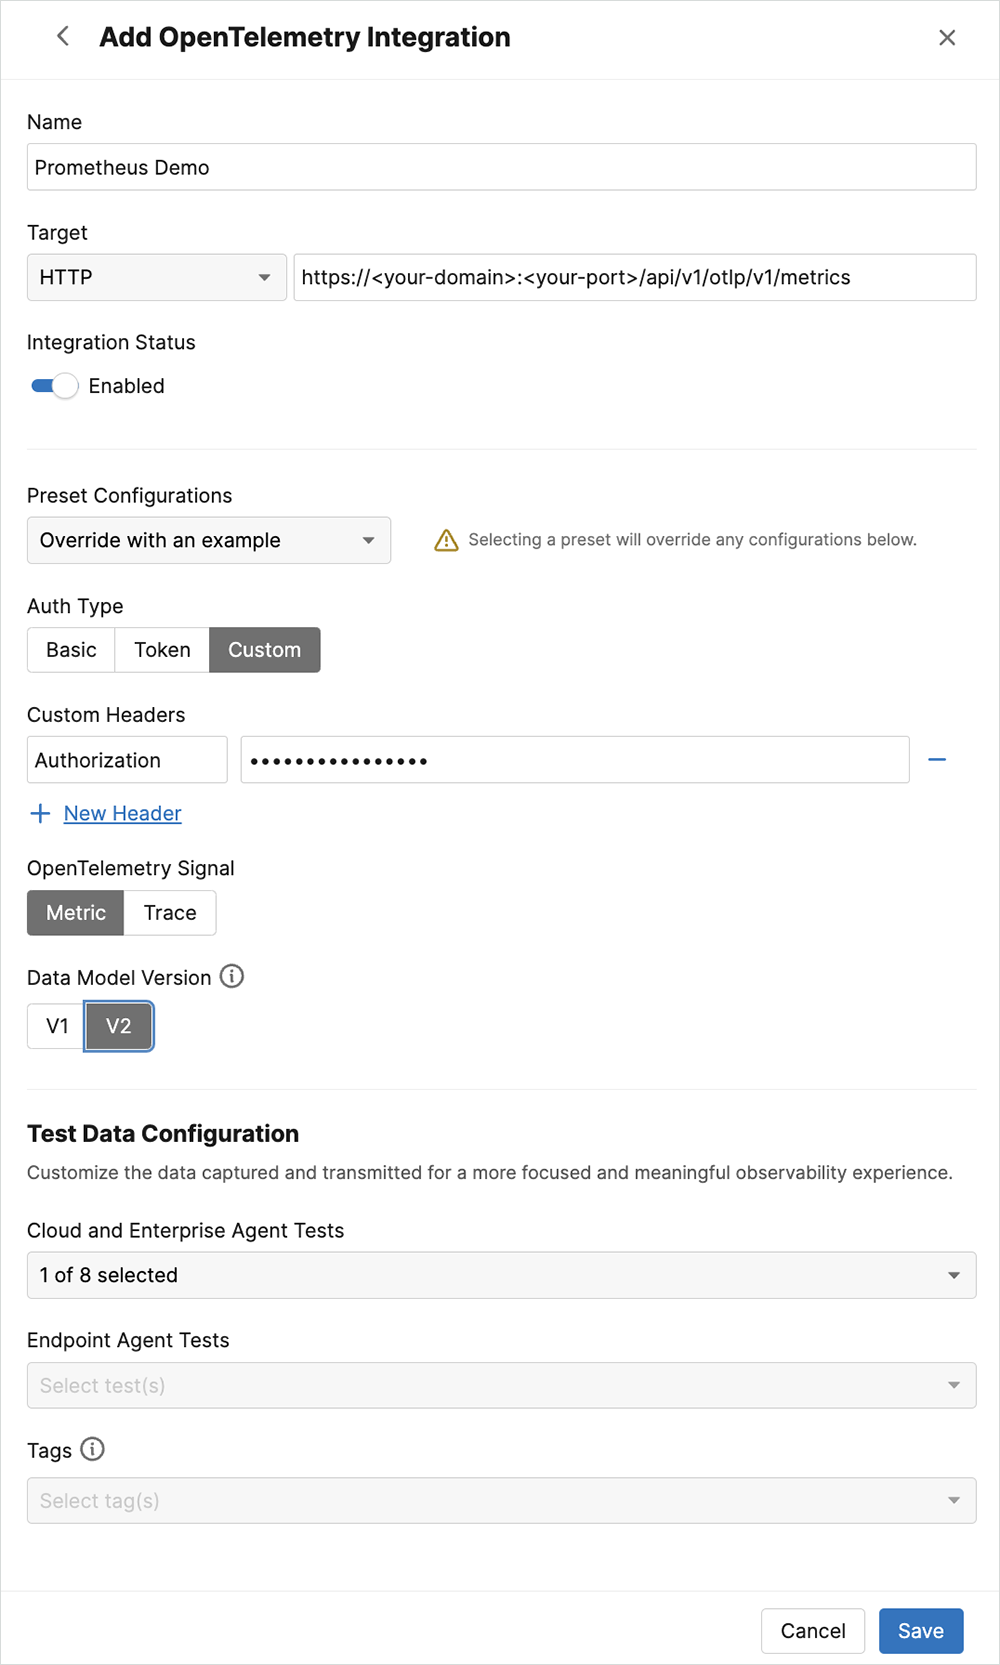
Create the OpenTelemetry integration using the following configuration:
- Target:
- HTTP
https://<your-domain>:<your-port>/api/v1/otlp/v1/metrics- Custom Header:
- "Authorization": "Basic <PASSWORD>"
- Select Data Model Version 2 as Prometheus allows us to promote resource attributes.
- Select the test that was just created.

For more information, visit the ThousandEyes Docs page on “Configuring ThousandEyes for OpenTelemetry Using the UI.”
Step 4: Receive Data in Prometheus
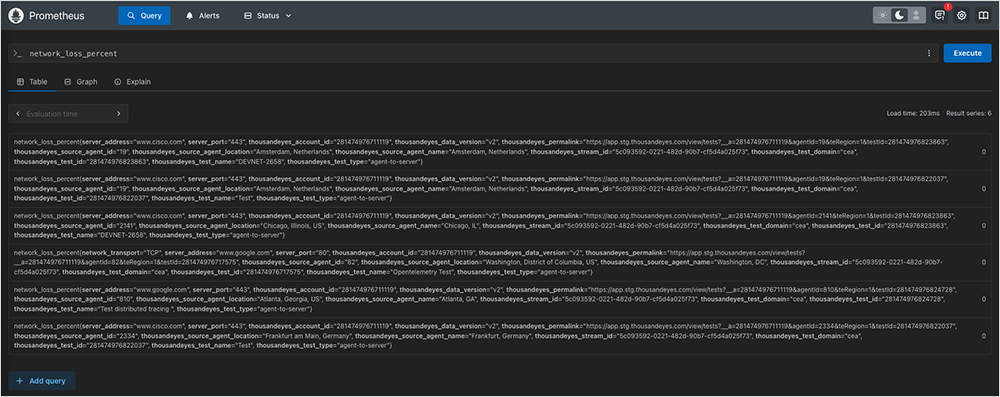
Now you can start receiving your ThousandEyes telemetry data on your Prometheus instance.

Step 5: Visualize Data in Grafana
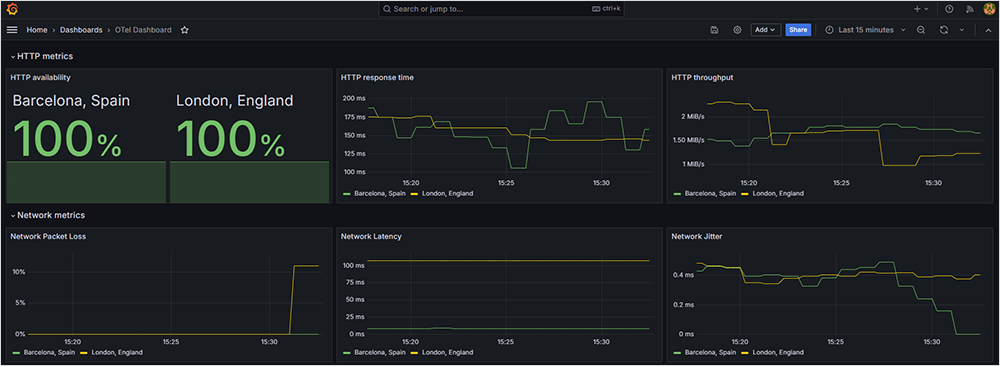
After getting data to Prometheus, configure your Prometheus instance as a data source in Grafana to visualize the data.

Note: Please refer to Grafana documentation on how to add Prometheus as a data source.
You can import the ThousandEyes dashboard from the file ThousandEyes+Grafana_model.json and follow this guide to install.